

Physics-
General
Easy
Question
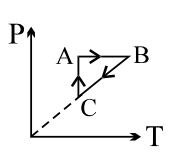
An ideal gas undergoes a thermodynamics cycle as shown in figure. Which of the following graphs represents the same cycle?


The correct answer is:
Related Questions to study
Physics-
A cylindrical tube of cross-sectional area A has two air tight frictionless pistons at its two ends. The pistons are tied with a straight two ends. The pistons are tied with a straight piece of metallic wire. The tube contains a gas at atmospheric pressure  and temperature
  If temperature of the gas is doubled then the tension in the wire is

A cylindrical tube of cross-sectional area A has two air tight frictionless pistons at its two ends. The pistons are tied with a straight two ends. The pistons are tied with a straight piece of metallic wire. The tube contains a gas at atmospheric pressure and temperature If temperature of the gas is doubled then the tension in the wire is
Physics-General
Physics-
An ideal gas is taken through the cycle  , as shown in the figure. If the net heat supplied to the gas in the cycle is 5 J, the work done by the gas in the process C→A is :

An ideal gas is taken through the cycle , as shown in the figure. If the net heat supplied to the gas in the cycle is 5 J, the work done by the gas in the process C→A is :
Physics-General
Physics-
 plots for two gases during adiabatic processes are shown in the figure. Plots 1 and 2 should correspond respectively to :

plots for two gases during adiabatic processes are shown in the figure. Plots 1 and 2 should correspond respectively to :
Physics-General

Physics-
One mole of a monoatomic ideal gas undergoes the process  in the given diagram. The specific heat for this process is :

One mole of a monoatomic ideal gas undergoes the process in the given diagram. The specific heat for this process is :
Physics-General
Physics-
The figure shows two paths for the change of state of a gas from A to B. The ratio of molar heat capacities in path 1 and path 2 is :

The figure shows two paths for the change of state of a gas from A to B. The ratio of molar heat capacities in path 1 and path 2 is :
Physics-General
Physics-
Pressure versus temperature graph of an ideal gas is as shown in figure corresponding density  versus volume (V) graph will be :

Pressure versus temperature graph of an ideal gas is as shown in figure corresponding density versus volume (V) graph will be :
Physics-General

Physics-
In the P-V diagram shown in figure  is a semicircle, The work done in the process
  is:
is:

In the P-V diagram shown in figure is a semicircle, The work done in the process is:
Physics-General
Physics-
Pressure versus temperature graph of an ideal gas is as shown in figure. Density of the gas at point A is  . Density at B will be :

Pressure versus temperature graph of an ideal gas is as shown in figure. Density of the gas at point A is . Density at B will be :
Physics-General
Physics-
Volume versus temperature graph of two moles of helium gas is as shown in figure. The ratio of heat absorbed and the work done by the gas in process 1-2 is :

Volume versus temperature graph of two moles of helium gas is as shown in figure. The ratio of heat absorbed and the work done by the gas in process 1-2 is :
Physics-General

Physics-
P-V diagram of an ideal gas is as shown in figure. Work done by the gas in the process ABCD is :

P-V diagram of an ideal gas is as shown in figure. Work done by the gas in the process ABCD is :
Physics-General
Physics-
A gas is expanded from volume  to
to  under three different processes. Process 1 is isobaric, process 2 is isothermal and process 3 is adiabatic. Let
  and
and  be the change in internal energy of the gas in these three processes. Then :

A gas is expanded from volume to under three different processes. Process 1 is isobaric, process 2 is isothermal and process 3 is adiabatic. Let and be the change in internal energy of the gas in these three processes. Then :
Physics-General
Physics-
Ideal gas is taken through the process shown in the figure :

Ideal gas is taken through the process shown in the figure :
Physics-General
Physics-
Pressure versus density graph of an ideal gas is shown in figure :

Pressure versus density graph of an ideal gas is shown in figure :
Physics-General
Physics-
Three moles of an ideal monoatomic gas performs a cycle  as shown. The gas temperatures in different states are,
  and
and  . The work done by the gas during the cycle is :

Three moles of an ideal monoatomic gas performs a cycle as shown. The gas temperatures in different states are, and . The work done by the gas during the cycle is :
Physics-General
Physics-
An ideal monoatomic gas undergoes a cyclic process ABCA as shown in the figure. The ratio of heat absorbed during AB to the work done on the gas during BC is :

An ideal monoatomic gas undergoes a cyclic process ABCA as shown in the figure. The ratio of heat absorbed during AB to the work done on the gas during BC is :
Physics-General


