

Question
The pressure P for a gas is plotted against its absolute temperature T for two different volumes  and
and  where
where  . If P is plotted on y - axis and T on x-axis, then :
- The curve for has greater slope than that for
- The curve for has greater slope than that for
- Both curves have same slope
- The curves intersect at some point other than T=0
has greater slope than that for
has greater slope than that for
 Hint:
Hint:
Using the ideal gas equation, we can find the relation between slope and volume.
The correct answer is: The curve for has greater slope than that for
For ideal gas equation, PV = nRT. For V = constant,  . Comparing with y = mx + c, m =
  . Thus, for a P-T graph, slope is inversely proportional to V. Since, V1 > V2, m2 > m1 Therefore, the curve for has greater slope than that for
Related Questions to study
An ideal gas is initially at temperature T and volume V. Its volume is increased by  due to an increase in temperature
  ⋅Pressure remaining constant . The physical quantity
  varies with temperature as :
An ideal gas is initially at temperature T and volume V. Its volume is increased by due to an increase in temperature ⋅Pressure remaining constant . The physical quantity varies with temperature as :
One litre of oxygen at a pressure of 1 atm and two litres of nitrogen at a pressure of 0.5 atm are introduced into a vessel of volume 1litre. If there is no change in temperature, the final pressure of the gas in atm is
One litre of oxygen at a pressure of 1 atm and two litres of nitrogen at a pressure of 0.5 atm are introduced into a vessel of volume 1litre. If there is no change in temperature, the final pressure of the gas in atm is
A spool of mass M and radius 2R lies on an inclined plane as shown in fig. A light thread is wound around the connecting tube of the spool and its free end carries a weight of mass m. The value of m so that system is in equilibrium is

A spool of mass M and radius 2R lies on an inclined plane as shown in fig. A light thread is wound around the connecting tube of the spool and its free end carries a weight of mass m. The value of m so that system is in equilibrium is

Two different curves at constant temperature. The relationship between volume V and the pressure P at a given temp. of same ideal gas are shown for masses  and
and  of the gas respectively. Then

Two different curves at constant temperature. The relationship between volume V and the pressure P at a given temp. of same ideal gas are shown for masses and of the gas respectively. Then
For an ideal gas V-T curves as constant pressures  are shown in figure - from the figure

For an ideal gas V-T curves as constant pressures are shown in figure - from the figure
Two gases A and B having the same pressure, P, volume V and temperature T are mixed. If the mixture has volume and temperature as V and T respectively the pressure of the mixture is
Two gases A and B having the same pressure, P, volume V and temperature T are mixed. If the mixture has volume and temperature as V and T respectively the pressure of the mixture is

The volume of agas at  is 100CC at normal pressure when it is heated to
  , its volume is 125CC at the same pressure the volume coeficient of the gas is
The volume of agas at is 100CC at normal pressure when it is heated to , its volume is 125CC at the same pressure the volume coeficient of the gas is
Compressibility factor (Z): Real gases deviate from ideal behavior due to the following two faulty assumptions of kinetic theory of gases.
i)Actual volume occupied by the gas molecule is negligible as compared to the total volume of the gases.
ii)Forces of attraction and repulsion among the gas molecules are negligible.
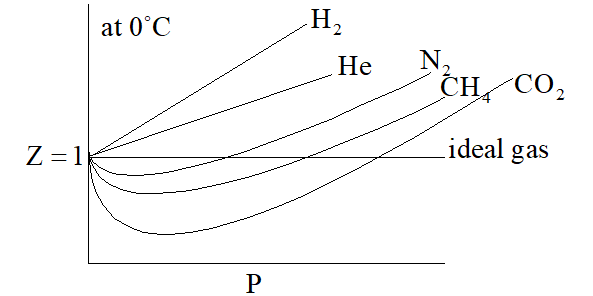
the, extent of deviation of the real gas from ideal behaviour, is explained in terms of compressibility factor (Z), which is function of pressure and temperature for real gas.
For ideal gas, Z = 1
For real gases, Z > 1 or Z < 1
When Z > 1, then it is less compressible because force of repulsion dominates over force of attraction when Z < 1, force of attraction dominates over the force repulsion.
Graph in between Z & P is shown as under
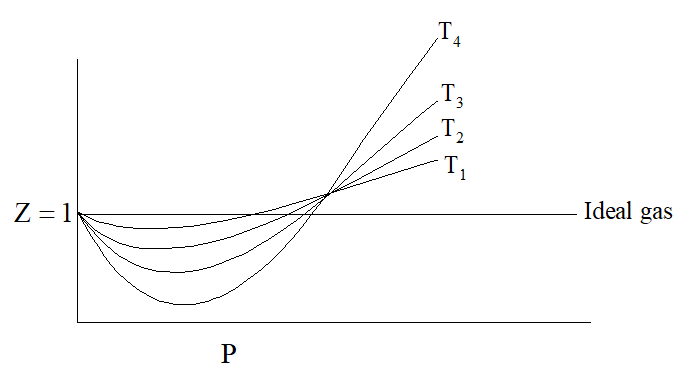
On increasing temperature, Z increases and approaches to unity. Graph between
Z and P at different temperature for the same gas is shown as under:
The van der Waal’s equation of state for 1 mole of gas is as under:
 …(1)
…(1)
Where a and b are van der Waal’s constants.
van der Waal’s constant “a” measures the amount of the force of attraction among the gas molecules. Higher the value of “a”, higher will be the ease of liquefaction.
Case (1)For H2 and He then equation into –I will reduce P(V – b) = RTCase (2) When pressure is too low i.e. for N2 or CH4 or, CO2 then equation (–I) reduces into 
Which of the following statement is correct as shown in the above graph?
Compressibility factor (Z): Real gases deviate from ideal behavior due to the following two faulty assumptions of kinetic theory of gases.
i)Actual volume occupied by the gas molecule is negligible as compared to the total volume of the gases.
ii)Forces of attraction and repulsion among the gas molecules are negligible.
the, extent of deviation of the real gas from ideal behaviour, is explained in terms of compressibility factor (Z), which is function of pressure and temperature for real gas.
For ideal gas, Z = 1
For real gases, Z > 1 or Z < 1
When Z > 1, then it is less compressible because force of repulsion dominates over force of attraction when Z < 1, force of attraction dominates over the force repulsion.
Graph in between Z & P is shown as under
On increasing temperature, Z increases and approaches to unity. Graph between
Z and P at different temperature for the same gas is shown as under:
The van der Waal’s equation of state for 1 mole of gas is as under:
…(1)
Where a and b are van der Waal’s constants.
van der Waal’s constant “a” measures the amount of the force of attraction among the gas molecules. Higher the value of “a”, higher will be the ease of liquefaction.
Case (1)For H2 and He then equation into –I will reduce P(V – b) = RTCase (2) When pressure is too low i.e. for N2 or CH4 or, CO2 then equation (–I) reduces into
Which of the following statement is correct as shown in the above graph?
I, II, III are three isotherm respectively at T1, T2 & T3 temperatures will be in order

I, II, III are three isotherm respectively at T1, T2 & T3 temperatures will be in order

In the figure shown, PT and PAB are the tangent and the secant drawn to a circle. If PT = 12 cm and PB = 8 cm then AB is

In the figure shown, PT and PAB are the tangent and the secant drawn to a circle. If PT = 12 cm and PB = 8 cm then AB is
Find the value of ‘x’ in the given figure

Find the value of ‘x’ in the given figure
‘0’ is the centre of the circle and  then
then 

Therefore the correct option is choice 3
‘0’ is the centre of the circle and then
Therefore the correct option is choice 3
In the given diagram,  Find the value of DC.

In the given diagram, Find the value of DC.
In the given figure, find the values of x y, and z

So we have given a quadrilateral where we have to find the angles x, y and z. The measurements of the angles and side lengths of quadrilaterals are used to categorise them. So the values of x, y and z are: 88°, 68°, 92°
In the given figure, find the values of x y, and z
So we have given a quadrilateral where we have to find the angles x, y and z. The measurements of the angles and side lengths of quadrilaterals are used to categorise them. So the values of x, y and z are: 88°, 68°, 92°
ABCD is a quadrilateral. AD and BD are the angle bisectors of angle A and B which meet at ‘O’. If 

So we have given a quadrilateral where we have AO and BO are the angle bisectors of angles A and B which meet at O. The measurements of the angles and side lengths of quadrilaterals are used to categorise them. So the angle AOB is 60 degree.
ABCD is a quadrilateral. AD and BD are the angle bisectors of angle A and B which meet at ‘O’. If
So we have given a quadrilateral where we have AO and BO are the angle bisectors of angles A and B which meet at O. The measurements of the angles and side lengths of quadrilaterals are used to categorise them. So the angle AOB is 60 degree.


