Question

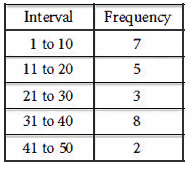
Each of the 25 data values in a data set is a different integer between 1 and 50, inclusive. The table gives the frequency of the data for five intervals. Which of the following intervals contains exactly  of the values in the data set?
- 1 to 20
- 11 to 30
- 21 to 40
- 31 to 50
The correct answer is: 31 to 50
The total data set is 7 + 5 + 3 + 8 + 2 = 25.
 of 25 = 10.
The interval that contains 10 data set is
1 to 20 - 7 + 5 = 12
11 to 30 - 5 + 3 = 8
21 to 40 - 3 + 8 = 11
31 to 50 - 8 + 2 = 10
The required answer is 31 – 50.
Related Questions to study
In 1855, Louis Remme traveled from Sacramento, California, to Portland, Oregon, stopping to rest for only 10 hours of the 143 hours it took him to reach Portland. If his average speed while traveling without resting was 5 miles per hour, how many miles did Louis Remme travel?
In 1855, Louis Remme traveled from Sacramento, California, to Portland, Oregon, stopping to rest for only 10 hours of the 143 hours it took him to reach Portland. If his average speed while traveling without resting was 5 miles per hour, how many miles did Louis Remme travel?
Based on the 2010 US census, the population of Milwaukee, Wisconsin, was about 96% of the population of Baltimore, Maryland. In 2010, if Milwaukee's population was about 595,000, which of the following is the best approximation of Baltimore's population?
Based on the 2010 US census, the population of Milwaukee, Wisconsin, was about 96% of the population of Baltimore, Maryland. In 2010, if Milwaukee's population was about 595,000, which of the following is the best approximation of Baltimore's population?
A field has a perimeter of 960 feet. Of the following, which is closest to the perimeter of the field, in meters? (1 foot = 0.3048 meter)
A field has a perimeter of 960 feet. Of the following, which is closest to the perimeter of the field, in meters? (1 foot = 0.3048 meter)
What is 120% of 2,000?
What is 120% of 2,000?

Ten data points are in the scatterplot shown, along with a line of best fit. Which of the following best estimates the predicted value of y when x = 6.5 ?

Ten data points are in the scatterplot shown, along with a line of best fit. Which of the following best estimates the predicted value of y when x = 6.5 ?
If s = 4, what is the value of 20s - 15s ?
If s = 4, what is the value of 20s - 15s ?
A square is inscribed in a circle with radius 6 inches. What is the perimeter of the square in inches?
A square's perimeter is the sum of the lengths of its four sides. As a result, we can calculate a square's perimeter by adding its four sides together. Each side of a square has the same length. Therefore, the side of a square is added four times to determine the perimeter of square.
Each side of a square with a 9-square-inch area is 3 inches long. Therefore, 3 inches multiplied by 3 inches equals 9 inches. (Length times height is a square's surface area formula.) A square has four sides; therefore, multiplying '3' by '4' gives us the perimeter, which is 12 inches.
A square is inscribed in a circle with radius 6 inches. What is the perimeter of the square in inches?
A square's perimeter is the sum of the lengths of its four sides. As a result, we can calculate a square's perimeter by adding its four sides together. Each side of a square has the same length. Therefore, the side of a square is added four times to determine the perimeter of square.
Each side of a square with a 9-square-inch area is 3 inches long. Therefore, 3 inches multiplied by 3 inches equals 9 inches. (Length times height is a square's surface area formula.) A square has four sides; therefore, multiplying '3' by '4' gives us the perimeter, which is 12 inches.


