

Question
The distance between a point source of light and a screen which is 60 cm is increased to 180 cm. The intensity on the screen as compared with the original intensity will be
- (1/9) times
- (1/3) times
- 3 times
- 9 times
The correct answer is: (1/9) times

Related Questions to study
The pole of the straight line 9x + y – 28 = 0 with respect to the circle  is
is
Pole and polar are one of the important parts of the circle, many questions can be based on these parts. It should be remembered that while writing the equation of polar for a pole, the coefficients of square terms in the equation of the circle is one. If the equation of the circle does not have coefficients as one, then make it one before solving the question.
The pole of the straight line 9x + y – 28 = 0 with respect to the circle is
Pole and polar are one of the important parts of the circle, many questions can be based on these parts. It should be remembered that while writing the equation of polar for a pole, the coefficients of square terms in the equation of the circle is one. If the equation of the circle does not have coefficients as one, then make it one before solving the question.
Three rods of equal length  are joined to form an equilateral triangle
  O is the mid point of
  Distance
  remains same for small change in temperature. Coefficient of linear expansion for
  and
and  is same,
  but that for
  is
is  Then
Then

Three rods of equal length are joined to form an equilateral triangle O is the mid point of Distance remains same for small change in temperature. Coefficient of linear expansion for and is same, but that for is Then
A point source causes photoelectric effect from a small metal plate Which of the following curves may represent the saturation photocurrent as a function of the distance between the source and the metal?

A point source causes photoelectric effect from a small metal plate Which of the following curves may represent the saturation photocurrent as a function of the distance between the source and the metal?

One of the following figures respesents the variation of particle momentum with associated de Broglie wavelength
a) 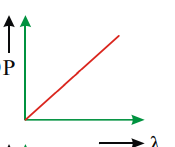
b) 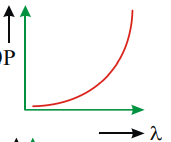
c) 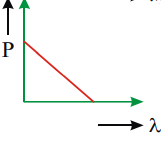

One of the following figures respesents the variation of particle momentum with associated de Broglie wavelength
a)
b)
c)
Two circular discs A and B with equal radii are blackened. They are heated to some temperature and are cooled under identical conditions. What inference do you draw from their cooling curves?

Two circular discs A and B with equal radii are blackened. They are heated to some temperature and are cooled under identical conditions. What inference do you draw from their cooling curves?
Which of the curves in figure represents the relation between Celsius and Fahrenheit temperatures

Which of the curves in figure represents the relation between Celsius and Fahrenheit temperatures

The area of circle centred at (1, 2) and passing through (4, 6) is
The area of a circle is the space occupied by the circle in a two-dimensional plane. Area of circle = πr2 (π = 22/7).
The area of circle centred at (1, 2) and passing through (4, 6) is
The area of a circle is the space occupied by the circle in a two-dimensional plane. Area of circle = πr2 (π = 22/7).
Three rods of same dimensions are arranged as shown in figure. They have thermal conductivities  and
and  . The points
  and
and  are maintained at different temperatures for the heat to flow at the same rate along
  and then which of the following options is correct

Three rods of same dimensions are arranged as shown in figure. They have thermal conductivities and . The points and are maintained at different temperatures for the heat to flow at the same rate along and then which of the following options is correct
In the following diagram if  then
then 
In the following diagram if then

The maximum kinetic energy (Ek ) of emitted photoelectrons against frequency v of incident radiation is plotted as shown in fig The slope of the graph is equal to

The maximum kinetic energy (Ek ) of emitted photoelectrons against frequency v of incident radiation is plotted as shown in fig The slope of the graph is equal to
In centre of the triangle formed by the lines y = x, y = 3x and y = 8 – 3x is
In centre of the triangle formed by the lines y = x, y = 3x and y = 8 – 3x is
 at a height of 3 m. The ratio of the intensities of illumination at a point on the centre of the edge and on the corner of the table is


