science
Grade6
Easy
Question
Which of the following representations of data is the least presentable form of data?
- Pie chart
- Bar graph
- Tabular
- Line graph

Tabular form is least preferred.
The correct answer is: Tabular
- Pie charts, bar graph and line graph are the most common charts used for visualizing data but tabular form is not.
- Tabular form do not have representable structure like pie, bar or line graphs.
- So, the correct option is c.
Related Questions to study
science
The time taken by a body to cover a particular distance can be taken in a distance-time graph in the units of ___.
The time taken by a body to cover a particular distance can be taken in a distance-time graph in the units of ___.
scienceGrade6
science
The distance covered by a body does not change with time. Its distance-time graph is ____.
The distance covered by a body does not change with time. Its distance-time graph is ____.
scienceGrade6
science
A car moves at a constant speed throughout its motion. Its distance-time graph is ___.
A car moves at a constant speed throughout its motion. Its distance-time graph is ___.
scienceGrade6
science
For which of the following situations the distance-time graph can be plotted?
- For uniform motion and stationary object it will be a straight line.
For which of the following situations the distance-time graph can be plotted?
scienceGrade6
- For uniform motion and stationary object it will be a straight line.
science
Which of the following representations of data is not a graphical representation?
Which of the following representations of data is not a graphical representation?
scienceGrade6
science
A car moves in such a way that it covers different distances every minute. Its distance-time graph will be ____.
A car moves in such a way that it covers different distances every minute. Its distance-time graph will be ____.
scienceGrade6
science
The distance-time graph of a tree planted on the ground is ____.
The distance-time graph of a tree planted on the ground is ____.
scienceGrade6
science
The distance traveled by a body can be taken in the distance-time graph in the units of ___.
The distance traveled by a body can be taken in the distance-time graph in the units of ___.
scienceGrade6
science
In the distance-time graph, the ____ of the object is plotted against ____.
In the distance-time graph, the ____ of the object is plotted against ____.
scienceGrade6
science
What can be inferred from the picture below?

What can be inferred from the picture below?

scienceGrade6
science
A vehicle covers a distance of 390 km while moving at a speed of 130 km/h. The time taken by the vehicle to cover this distance is ___ hours.
A vehicle covers a distance of 390 km while moving at a speed of 130 km/h. The time taken by the vehicle to cover this distance is ___ hours.
scienceGrade6
science
Veer noticed that while driving a car the speedometer showed a constant speed of 90 km/h for 10 minutes. The distance travelled by the car is ____ km during this time.
Veer noticed that while driving a car the speedometer showed a constant speed of 90 km/h for 10 minutes. The distance travelled by the car is ____ km during this time.
scienceGrade6
science
The odometer reading of a motorcycle shows 5476 km before Mary started riding on it. When she stopped, the reading stood at 5927 km. He has travelled a distance of ___ km.
The odometer reading of a motorcycle shows 5476 km before Mary started riding on it. When she stopped, the reading stood at 5927 km. He has travelled a distance of ___ km.
scienceGrade6
science
A car covers a distance of 240 meters in 5 seconds. The speed of the car is ___ m/s.
A car covers a distance of 240 meters in 5 seconds. The speed of the car is ___ m/s.
scienceGrade6
science
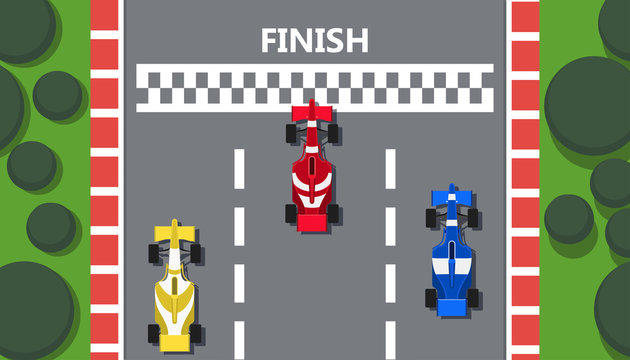
The snap of a car race taken right before the race was over is shown below. Arrange these cars in the descending order of their speeds.

The snap of a car race taken right before the race was over is shown below. Arrange these cars in the descending order of their speeds.

scienceGrade6


