Question

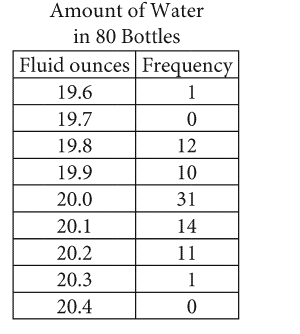
The frequency table above shows the distribution of the actual number of fluid ounces of water in a random sample of 80 20-ounce bottles of the water at a bottling plant. Bottles are only sold if they contain at least 19.8 but no more than 20.2 fluid ounces of water. If the proportion of bottles that can be sold is the same for the sample and the 16,000 20-ounce bottles produced at the plant each day, how many of the 16,000 bottles cannot be sold?
- 800
- 600
- 400
- 200
The correct answer is: 400


= 400
Related Questions to study
A local restaurant gives teachers a 20% discount on all their meals. If a teacher pays $14.00 for a meal after the discount was applied, what was the price of the meal before the discount?
A local restaurant gives teachers a 20% discount on all their meals. If a teacher pays $14.00 for a meal after the discount was applied, what was the price of the meal before the discount?
Haimi drove a car from West Union, Minnesota, through North Dakota, to Miles City, Montana. The total distance she traveled through each state is shown in the figure.

The distance d, in miles, Haimi drove as a function of the time t, in hours, since she started driving is modeled by the equation d = 60t.
What interval represents all values of t during which Haimi drove in North Dakota?
Haimi drove a car from West Union, Minnesota, through North Dakota, to Miles City, Montana. The total distance she traveled through each state is shown in the figure.

The distance d, in miles, Haimi drove as a function of the time t, in hours, since she started driving is modeled by the equation d = 60t.
What interval represents all values of t during which Haimi drove in North Dakota?
Haimi drove a car from West Union, Minnesota, through North Dakota, to Miles City, Montana. The total distance she traveled through each state is shown in the figure.

The distance d, in miles, Haimi drove as a function of the time t, in hours, since she started driving is modeled by the equation d = 60t.
According to the model, what distance, in miles, had Haimi driven 3 hours after she started driving?
Haimi drove a car from West Union, Minnesota, through North Dakota, to Miles City, Montana. The total distance she traveled through each state is shown in the figure.

The distance d, in miles, Haimi drove as a function of the time t, in hours, since she started driving is modeled by the equation d = 60t.
According to the model, what distance, in miles, had Haimi driven 3 hours after she started driving?
The function f is defined by f(x) = x2- 7. What is the value of f(3) ?
The function f is defined by f(x) = x2- 7. What is the value of f(3) ?
The combustion of glucose releases energy. The ratio of grams of glucose combusted to kilocalories of energy released is 12.0 to 45.0. How many grams of glucose must be combusted to provide 85.5 kilocalories of energy?
The combustion of glucose releases energy. The ratio of grams of glucose combusted to kilocalories of energy released is 12.0 to 45.0. How many grams of glucose must be combusted to provide 85.5 kilocalories of energy?

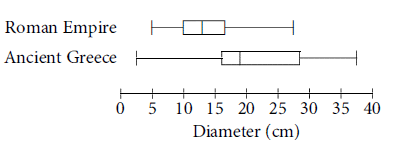
The Metropolitan Museum of Art has plates on display from the Roman Empire and ancient Greece. The box plots shown summarize the distributions of the diameters, in centimeters, of all the museum's plates from each region. How does the median diameter of the plates from the Roman Empire, r, compare to the median diameter of the plates from ancient Greece, g ?

The Metropolitan Museum of Art has plates on display from the Roman Empire and ancient Greece. The box plots shown summarize the distributions of the diameters, in centimeters, of all the museum's plates from each region. How does the median diameter of the plates from the Roman Empire, r, compare to the median diameter of the plates from ancient Greece, g ?

In the given equation, k is a constant. The equation has no solution. What is the value of k ?

In the given equation, k is a constant. The equation has no solution. What is the value of k ?
4x + y = 7
2x - 7y = 1
If (x, y) is the solution to the given system of equations, what is the value of x ?
4x + y = 7
2x - 7y = 1
If (x, y) is the solution to the given system of equations, what is the value of x ?
x2-2x -1 = 0
The equation above has solutions  , and
, and  , where n and k are positive integers. What is the value of n + k ?
x2-2x -1 = 0
The equation above has solutions  , and
, and  , where n and k are positive integers. What is the value of n + k ?

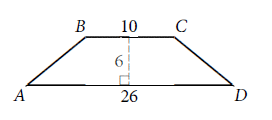
In the figure shown,  is parallel to
  and AB = CD. What is the perimeter of quadrilateral ABCD?

In the figure shown,  is parallel to
  and AB = CD. What is the perimeter of quadrilateral ABCD?
4T - 8D = 12H
The given equation can be rewritten as T = aD + bH, where a and bare constants. What is the value of a ?
4T - 8D = 12H
The given equation can be rewritten as T = aD + bH, where a and bare constants. What is the value of a ?
Two beach balls are each in the shape of a sphere. The larger beach ball has a diameter of 3x, and the smaller beach ball has a diameter of x. What is the ratio of the volume of the larger beach ball to the volume of the smaller beach ball?
Two beach balls are each in the shape of a sphere. The larger beach ball has a diameter of 3x, and the smaller beach ball has a diameter of x. What is the ratio of the volume of the larger beach ball to the volume of the smaller beach ball?
y = (x - 1)(x + 2)(x + 2)
The graph in the xy-plane of the equation above contains the point (a, b). If -1 a
a 1, which of the following is NOT a possible value of b ?
Every term in a linear equation has an exponent of 1, so when it is graphed, it always results in a straight line. So, it is referred to as a "linear equation."
¶Both one-variable and two-variable linear equations exist. The linear equation formula is used to express a linear equation. There are numerous ways to accomplish this. For example, the linear equation can be expressed in standard, slope-intercept, or point-slope forms. Taking a linear equation in standard form,
¶Several methods for resolving linear equations in two variables include the graphical approach, substitution techniques, cross-multiplication techniques, elimination techniques, and determinant approaches.
y = (x - 1)(x + 2)(x + 2)
The graph in the xy-plane of the equation above contains the point (a, b). If -1 a
a 1, which of the following is NOT a possible value of b ?
Every term in a linear equation has an exponent of 1, so when it is graphed, it always results in a straight line. So, it is referred to as a "linear equation."
¶Both one-variable and two-variable linear equations exist. The linear equation formula is used to express a linear equation. There are numerous ways to accomplish this. For example, the linear equation can be expressed in standard, slope-intercept, or point-slope forms. Taking a linear equation in standard form,
¶Several methods for resolving linear equations in two variables include the graphical approach, substitution techniques, cross-multiplication techniques, elimination techniques, and determinant approaches.
Which expression is equivalent to (2x2+ 3x - 2) - (5x2- x - 7) ?
Which expression is equivalent to (2x2+ 3x - 2) - (5x2- x - 7) ?
The equation h = 150 + 10t gives the total number of housing units, h, in a community t months after a new zoning law was passed. How many housing units are added to the community each month after the zoning law was passed?
A graph illustrates the connection between two or more variables. An upward-sloping curve denotes a clear correlation between the two variables, and a curve with a downward slope denotes a negative correlation between the two variables.
A relationship between two variables can be measured and described using the statistical approach of correlation. Typically, the two variables are not changed. Therefore, two identical-person scores are necessary for the association. These results are represented as X and Y.


