

Physics-
General
Easy
Question
The acceleration-time graph of a body is shown below

The most probable velocity-time graph of the body is
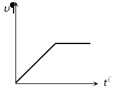


The correct answer is:
From given  graph it is clear that acceleration is increasing at constant rate

 (constant) Þ
  (by integration)
Þ  Þ
Þ 
Þ  Þ
Þ
i.e. v is dependent on time parabolically and parabola is symmetric about v-axis.
and suddenly acceleration becomes zero. i.e. velocity becomes constant.
Hence (c) is most probable graph
Related Questions to study
physics-
The given graph shows the variation of velocity with displacement. Which one of the graph given below correctly represents the variation of acceleration with displacement

The given graph shows the variation of velocity with displacement. Which one of the graph given below correctly represents the variation of acceleration with displacement
physics-General
physics-
Acceleration-time graph of a body is shown. The corresponding velocity-time graph of the same body is

Acceleration-time graph of a body is shown. The corresponding velocity-time graph of the same body is
physics-General
physics-
A train moves from one station to another in 2 hours time. Its speed-time graph during this motion is shown in the figure. The maximum acceleration during the journey is

A train moves from one station to another in 2 hours time. Its speed-time graph during this motion is shown in the figure. The maximum acceleration during the journey is
physics-General

physics-
The graph of displacement v/s time is  Its corresponding velocity-time graph will be
The graph of displacement v/s time is Its corresponding velocity-time graph will be
physics-General
physics-
A ball is dropped vertically from a height  above the ground. It hits the ground and bounces up vertically to a height
  . Neglecting subsequent motion and air resistance, its velocity
  varies with the height
  above the ground is
A ball is dropped vertically from a height above the ground. It hits the ground and bounces up vertically to a height . Neglecting subsequent motion and air resistance, its velocity varies with the height above the ground is
physics-General
physics-
The displacement-time graph of moving particle is shown below

The instantaneous velocity of the particle is negative at the point
The displacement-time graph of moving particle is shown below
The instantaneous velocity of the particle is negative at the point
physics-General

physics-
In the following graph, distance travelled by the body in metres is

In the following graph, distance travelled by the body in metres is
physics-General
physics-
For the velocity-time graph shown in figure below the distance covered by the body in last two seconds of its motion is what fraction of the total distance covered by it in all the seven seconds

For the velocity-time graph shown in figure below the distance covered by the body in last two seconds of its motion is what fraction of the total distance covered by it in all the seven seconds
physics-General
physics-
Velocity-time (v-t) graph for a moving object is shown in the figure. Total displacement of the object during the time interval when there is non-zero acceleration and retardation is

Velocity-time (v-t) graph for a moving object is shown in the figure. Total displacement of the object during the time interval when there is non-zero acceleration and retardation is
physics-General

physics-
The velocity-time graph of a body moving in a straight line is shown in the figure. The displacement and distance travelled by the body in 6 sec are respectively

The velocity-time graph of a body moving in a straight line is shown in the figure. The displacement and distance travelled by the body in 6 sec are respectively
physics-General
physics-
A lift is going up. The variation in the speed of the lift is as given in the graph. What is the height to which the lift takes the passengers

A lift is going up. The variation in the speed of the lift is as given in the graph. What is the height to which the lift takes the passengers
physics-General
physics-
The  graph shown in figure represents

The graph shown in figure represents
physics-General
physics-
The displacement versus time graph for a body moving in a straight line is shown in figure. Which of the following regions represents the motion when no force is acting on the body

The displacement versus time graph for a body moving in a straight line is shown in figure. Which of the following regions represents the motion when no force is acting on the body
physics-General
physics-
The  graph of a moving object is given in figure. The maximum acceleration is

The graph of a moving object is given in figure. The maximum acceleration is
physics-General
physics-
The graph between the displacement  and time
  for a particle moving in a straight line is shown in figure. During the interval
  and
and  , the acceleration of the particle is

OA, AB, BC, CD
The graph between the displacement and time for a particle moving in a straight line is shown in figure. During the interval and , the acceleration of the particle is
OA, AB, BC, CD
physics-General


