Question
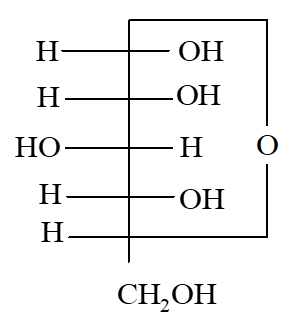
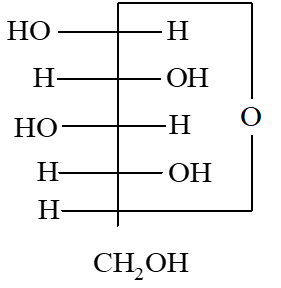
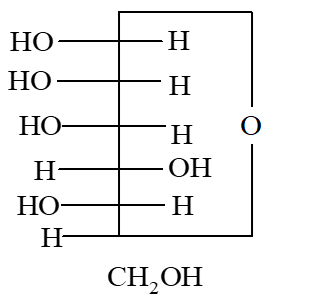
Which of the following show linkage group in coupling phase
The correct answer is: 
Related Questions to study
The linkage map of X-chromosome of fruitfully has 66 units, with yellow body gene (y) at one end and bodded hair (b) gene at the other end. The recombination frequency between these two genes (y and b) should be -
The linkage map of X-chromosome of fruitfully has 66 units, with yellow body gene (y) at one end and bodded hair (b) gene at the other end. The recombination frequency between these two genes (y and b) should be -
Match the following

Match the following

Match the following

Match the following

Study the pedigree chart given below What does it show

Study the pedigree chart given below What does it show

Which of the following polymer can be formed by using the following monomer unit?

Which of the following polymer can be formed by using the following monomer unit?

 is a polymer having monomer units
 is a polymer having monomer units
Consider function f(x) satisfies the relation,  and differentiable for all x.


In this question, we have given two statements are like assertion and reason. The odd function is, a function such that f (−x) =−f (x) where the sign is reversed but the absolute value remains the same if the sign of the independent variable is reversed.
Consider function f(x) satisfies the relation,  and differentiable for all x.


In this question, we have given two statements are like assertion and reason. The odd function is, a function such that f (−x) =−f (x) where the sign is reversed but the absolute value remains the same if the sign of the independent variable is reversed.
Electronic configuration  has violated:
Electronic configuration  has violated:
The figure indicates the energy level diagram for the origin of six spectral lines in emission spectrum (e.g. line no. 5 arises from the transition from level B to X ) which of the following spectral lines will not occur in the absorption spectrum :

The figure indicates the energy level diagram for the origin of six spectral lines in emission spectrum (e.g. line no. 5 arises from the transition from level B to X ) which of the following spectral lines will not occur in the absorption spectrum :

The conductivity of 0.001 M acetic acid is 5 × 10⁻⁵ S cm–1 and  is 390.5 S cm2 mol–1 then the calculated value of dissociation constant of acetic acid would be
The conductivity of 0.001 M acetic acid is 5 × 10⁻⁵ S cm–1 and  is 390.5 S cm2 mol–1 then the calculated value of dissociation constant of acetic acid would be
Titration curves for 0.1M solution of three weak acids HA1 , HA2 and HA3 with ionization constants K1 , K2 and K3 respectively are plotted as shown in the figure. Which of the following is /are true?

Titration curves for 0.1M solution of three weak acids HA1 , HA2 and HA3 with ionization constants K1 , K2 and K3 respectively are plotted as shown in the figure. Which of the following is /are true?

Three cyclic structures of monosaccharides are given below which of these are anomers
I) 
II) 
III) 
Three cyclic structures of monosaccharides are given below which of these are anomers
I) 
II) 
III) 
In the following structure, anomeric carbon is

In the following structure, anomeric carbon is

Family  of curve represented by the differential equation of degree
In this question, we have to find the degree of the differential equation. The degree is highest power or order of the derivative in the differential equation.
Family  of curve represented by the differential equation of degree
In this question, we have to find the degree of the differential equation. The degree is highest power or order of the derivative in the differential equation.


